تحليل سعر BTC ليوم 6 مايو
اتجاه بيتكوين الحالي ونطاق السعر
تُظهر الشكل 1 رسم بياني للاتجاه اليومي لزوج BTC/USDT. من الصورة، من الواضح أنه بعد لمس منطقة مقاومة السعر المُشار إليها بواسطة منطقة الضغط الأفقية البيضاء في مايو 2025، عاش السعر على الفور انخفاضاً كبيراً. يجدر بالذكر أنه خلال فبراير 2025، عاش السعر أيضاً فترة توحيد بالقرب من هذا النطاق. في المستقبل، يجب أن يُولى اهتمام خاص لحجم التداول وما إذا كان اتجاه السعر يحقق اختراقاً أم ينخفض دون نطاق التوحيد.

(الشكل 1، المصدر: ترادينج فيو 2025.5.6)
BTC التركيز على السعر المستهدف والهدف
الرقم الثاني يظهر رسم بياني لاتجاه مستوى 4 ساعات لزوج BTC/USDT. يمكن رؤية المنطقة البيضاء في الرسم البياني كمنطقة دعم رئيسية، بينما الخط الصاعد الأصفر هو دعم مهم على المدى القصير، والخط الأخضر الأفقي يشكل الدعم السفلي لنطاق التوحيد الحالي. في المستقبل، إذا انخفض السعر أدنى الخط الصاعد الأصفر، من المهم الانتباه إلى مستوى الدعم حوالي 92،700. إذا تم اختراق هذا الدعم، قد يختبر السعر مستوى 91،000؛ على العكس، إذا نجح السعر في اختراق منطقة المقاومة حوالي 96،000، يمكن تركيز الاهتمام على نطاق الهدف من 98،000 - 100،000.
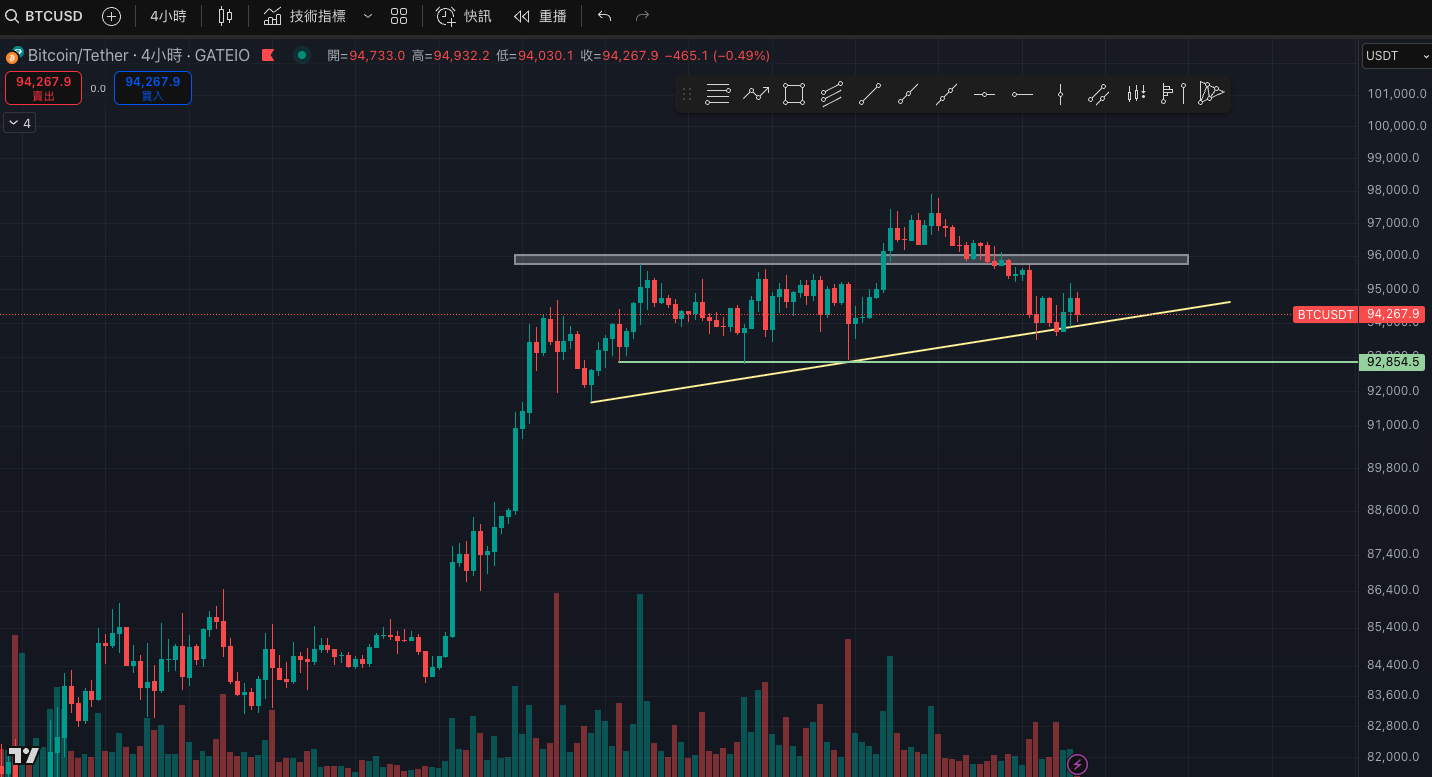
(الشكل 2، المصدر: TradingView 2025.5.6)
ابدأ التداول بالبيتكوين الحالي: https://www.gate.io/trade/BTC_USDT
ملخص
البتكوين أمام العيون في مرحلة اختبار ضغط رئيسية. إذا لم يتمكن السعر من الوقوف بفعالية فوق نطاق 96،000 دولار، فإن هناك لا يزال احتمال لاختبار الدعم عند 92،700 إلى 91،000 دولار في المدى القصير. بمجرد اختراق منطقة الضغط بنجاح، من المتوقع أن يرتفع زخم السوق إلى المستوى الصحيح من 98،000 إلى 100،000 دولار. قبل أن يصبح الاتجاه واضحًا، يجب على الشخص الاستمرار في مراقبة حجم التداول وسلوك الأسعار وتبني استراتيجية أكثر حذرًا ومرونة بالاستجابة.
المقالات ذات الصلة

ما هي عملة إيلون الرسمية (ELON)؟

تحليل قيمة عملة Pi: الآفاق المستقبلية لعملة Pi في سوق العملات الرقمية

قيمة PI Crypto: إطلاق الشبكة الرئيسية في 20 فبراير 2025 وتوقعات السعر المستقبلية

كم يمكن أن يرتفع XRP؟ كيف سيؤثر سياسة العملات المشفرة لترامب على الاتجاه المستقبلي لـ XRP؟

ما هو N2: حلاً مدفوعًا بالذكاء الاصطناعي طبقة 2
